
Keeping clients' computers safe and profitable for over 30 years
Home Forms About Current Newsletter subscribe
Search All Articles
Browse by Category

MemInfo, Useful free tool
 MemInfo is a small graphic gauge showing memory usage in real time. This is useful as some programs fail to give back memory they have used, so as time goes by without rebooting, you lose more and more of your memory. Furthermore, sometimes a process goes wild, and you can see the memory climb, indicating the problem. This useful gauge also lets you quickly see which programs are using the most memory.
MemInfo is very configurable and will even release unused memory with just a couple of clicks.
This is how I normally set it up:
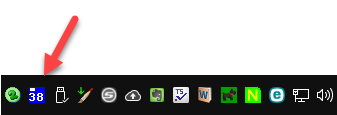
It is in my system tray and showing that I'm using 38% of my available memory. I set it for a blue background with white print and gauge to be easy for me to see.
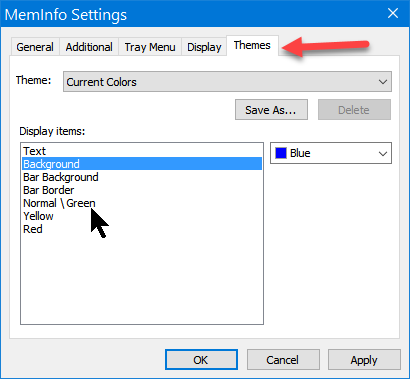
From the General tab, I choose percentage of memory used, rather than either amount used or available.
Right clicking on the gauge shows which 10 programs are using the most memory and even allows you to release unused memory.
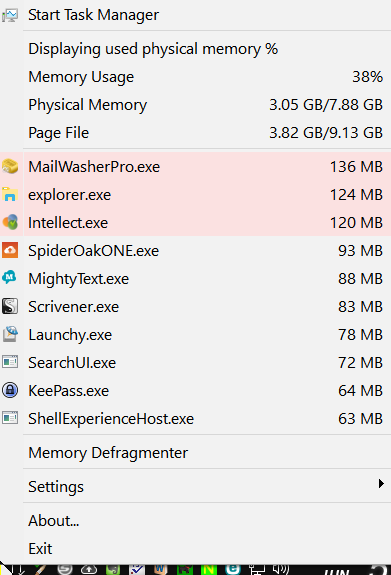
It highlights those programs using more than 100 MB.
Finally, the Memory Defragmenter, doesn't really defragment the memory but returns some unused memory to Windows so it becomes accessible again. The program itself uses very little memory and virtually no CPU resources.
Date: July 2017

This article is licensed under a Creative Commons Attribution-NoDerivs 3.0 Unported License.